Demand, Fit, and Signals: How to Prioritize B2B Opportunities in Mexico's Western and North Pacific Region
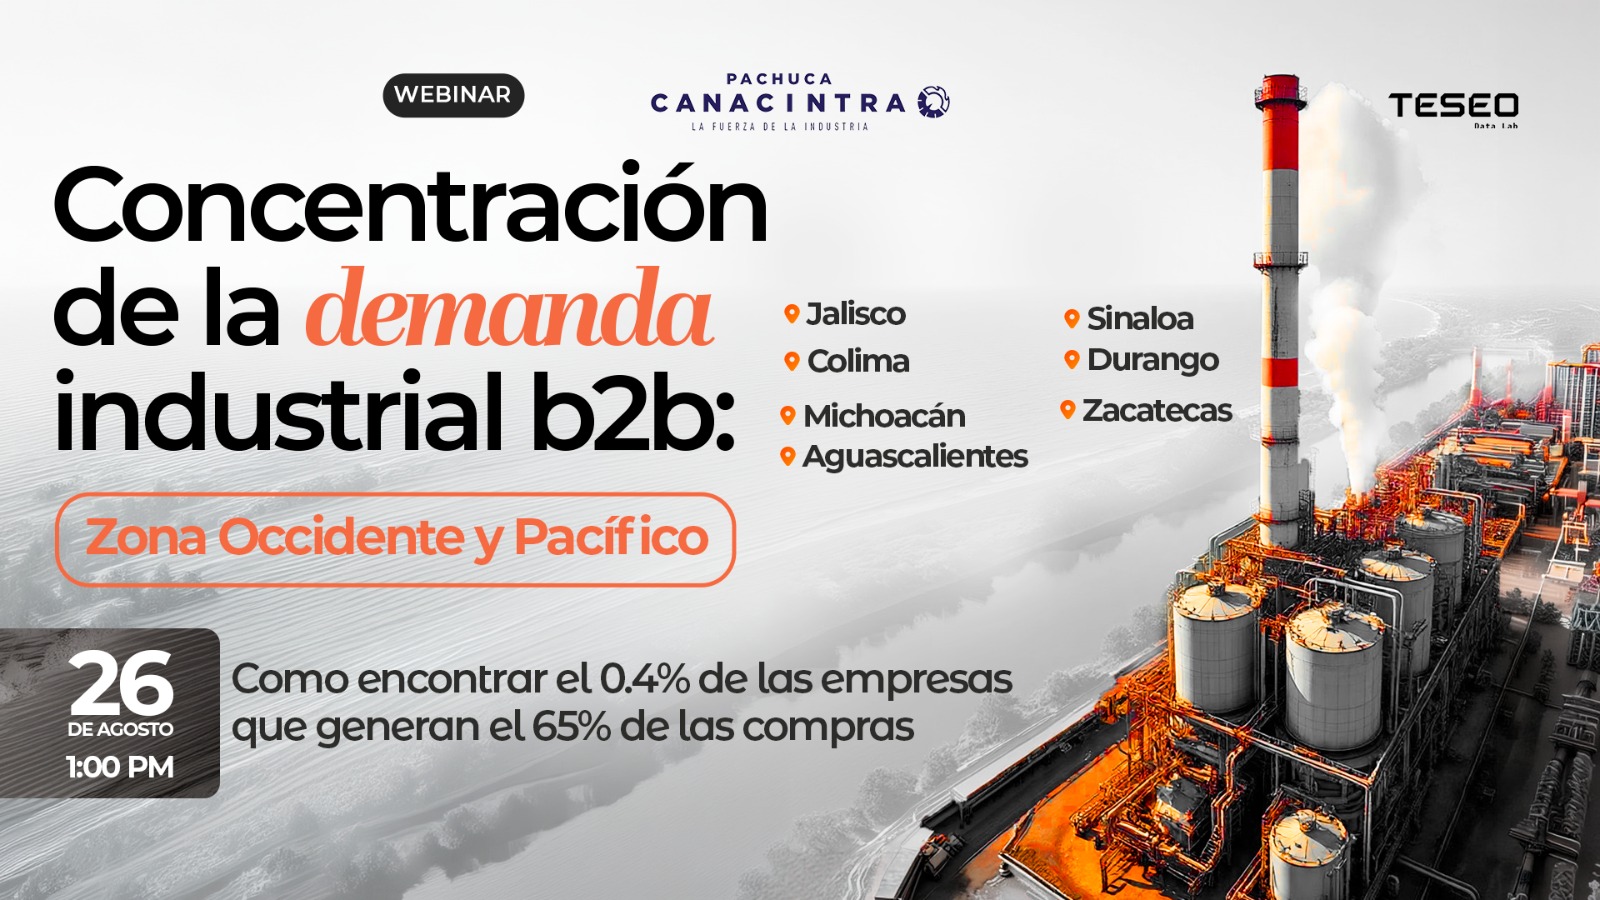
Mexico's Western–North Pacific region concentrates more than one million economic units and more than 116,000 manufacturing units. For a B2B company, however, the real challenge is not building an ever-larger list, but determining which markets, chains, corridors, and accounts actually justify sales time.
That was the starting point of the webinar "Concentration of B2B Industrial Demand: Western and Pacific Region", presented by Teseo Data Lab in collaboration with CANACINTRA Pachuca, the Pachuca chapter of Mexico's National Chamber of the Manufacturing Industry, on August 26, 2026.
▶️ Watch the full webinar on YouTube — the recording with the complete analysis of the region.
This session is the regional application of a thesis we presented earlier at the national level: industrial demand is not dispersed, but concentrated. If you missed that analysis, start with how to find the real industrial opportunity in Mexico.
The session started from an essential difference between two ways of prospecting.
In dispersed prospecting, thousands of accounts receive practically the same effort, the message barely changes from one industry to the next, and priorities tend to depend on experience or intuition.
A prioritized strategy does the opposite: it progressively narrows the universe until all that remains are compatible markets, serviceable corridors, evidence-backed accounts, and signals that point to a reasonable moment to reach out.
The question then stops being "How many companies can I contact?" and becomes "Where is it worth selling first?"
The Western–North Pacific region has enough scale to justify an industrial strategy of its own. The analysis presented during the webinar estimates a regional GDP of approximately MXN 5.85 trillion, equivalent to 17.4% of national GDP, along with 4.27 million formal jobs and USD 26,681.6 million in state exports during the first quarter of 2026.
But none of those figures, on its own, answers where a company should prospect.
Jalisco, for example, concentrates approximately 43.3% of regional GDP. At first glance, it might look like the obvious destination for any sales strategy. Once other variables come in, the map changes.
Aguascalientes has a smaller economy than Michoacán, yet it ranks second in the region for exports in Q1 2026. Sinaloa shows a different B2B intensity, while states such as Colima or Nayarit carry less total economic weight but concentrate specific chains linked to ports, agribusiness, mining, or food.
The lesson matters: economic scale and commercial opportunity are not synonyms.
A company should not choose a territory only because it has a higher GDP, exports more, or is receiving investment. Priority emerges when these variables are crossed with what the company actually sells and can serve.
An industrial market can be large without accelerating; another can post high growth rates on a much smaller base. The webinar illustrated that difference with three cases.
Jalisco combined high export scale with strong acceleration in Q1 2026. Zacatecas posted significant percentage growth on a much smaller base. Aguascalientes, in contrast, maintained high export scale even while recording a negative year-over-year change that quarter.
That is why an isolated growth rate is not enough to define priority either.
Something similar happens with foreign investment. The region went from USD 888.5 million in executed FDI in Q1 2025 to USD 1,606.6 million in Q1 2026, according to the data used in the report. Commercially, though, what matters is both the amount and the stage of the project:
The same asset can generate different opportunities depending on when a company tries to get in.
This was one of the most important filters presented during the session.
The analysis starts from approximately MXN 1.16 trillion in observed manufacturing spending, but most of it corresponds to raw materials and merchandise. After excluding those components, along with energy and other items that are not broken down in enough detail, the report identifies around MXN 135,813 million as the observed floor of identifiable B2B services and supply.
The distinction is fundamental: that amount does not represent available budget or purchase intent. It is a floor of observable activity that still needs filters for compatibility, geography, service capacity, supplier qualification process, and specific account.
Within that universe, four categories accounted for approximately 80.6% of observable B2B spending in the analysis:
| Category | Observed B2B |
|---|---|
| Packaging and supplies | MXN 33,477.6 million |
| Logistics and transportation | MXN 27,783.4 million |
| Maintenance and MRO | MXN 27,389.3 million |
| Facilities management | MXN 20,787.6 million |
Together they represent approximately MXN 109,437.9 million of the observed market for the categories analyzed.
But even here, it would be wrong to simply conclude that "packaging is the best category." The next filter changes the reading once again.
A commercial category takes on a different value depending on the production process it serves.
In the analysis presented by Teseo Data Lab, food and beverages accounted for about 40.3% of observed B2B spending among the subsectors considered. However, selling packaging to a food company does not involve the same need, barrier, or buying process as selling it to an electronics company.
That is why the methodology does not stop at the category. It crosses category × production chain, and then brings in variables such as spending scale, process compatibility, purchase recurrence, barrier to entry, and sales cycle.
One figure from the presentation helps put it in perspective: packaging linked to food concentrates a considerably larger observed floor than the same item within electronics. It is the same commercial category, but in operationally different markets.
This also changes the sales message. A food company may value lower shrinkage, cold-chain continuity, or shelf life. An automotive operation may focus on line stoppages, synchronization, quality, and supplier qualification. A mining company may prioritize safety, asset availability, or the cost of downtime.
The category tells you what you can sell. The chain helps you understand why they might buy it from you.
Another important change in the unit of analysis happens when the strategy moves from the state to the corridor.
Teseo Data Lab identified corridors such as Manzanillo–Guadalajara–Aguascalientes–Zacatecas, Lázaro Cárdenas–Morelia–Guadalajara, Guadalajara–Tepic–Mazatlán–Culiacán, and Mazatlán–Durango, each connected to different production chains and needs.
The state works as a statistical unit. The corridor works as a commercial unit of execution.
A company may identify an attractive account in another state and still discover that it lacks the competitive costs, technical capacity, or response times needed to serve it. That is why commercial geography must factor in service radius, infrastructure, travel times, a territory owner, and real coverage capacity.
The webinar took the methodology from the region down to a specific account through the example of Grupo PINSA in Mazatlán.
The analysis does not claim that the company was buying. What it identifies is enough evidence to justify deeper research: operating scale, critical processes, potentially compatible categories, need hypotheses, and roles that could take part in a decision.
This distinction is central to any serious commercial intelligence model: attractive account ≠ purchase intent. And there is one more filter: attractive account ≠ accessible opportunity.
An account needs to clear at least four questions:
| Filter | Sales question |
|---|---|
| Technical | Can I solve the problem? |
| Territorial | Can I serve this operation competitively? |
| Organizational | Do I have a reasonable path to users and purchasing? |
| Timing | Is there a reason to talk now? |
Accessibility is what turns an interesting company into an account that truly deserves effort.
One of the clearest tests of the method came in account selection.
The analysis began with 96 candidate companies. After validating plant, municipality, activity, signal, compatibility, and evidence, 89 ended up with auditable profiles. In the end, 35 were selected as priority accounts: five rated AAA and 30 rated Tier A.
This means that 54 accounts that initially seemed attractive enough did not make it into the priority portfolio. That number matters because it shows the goal of the methodology: not to fill a sales database, but to narrow it down.
The scoring model considers variables such as the subsector's B2B intensity, recent signals, local scale, quality of evidence, location, and compatibility, as well as penalties when there are issues such as suspended projects or incorrectly attributed signals.
An account does not get priority just because it is large. It needs to combine size, evidence, and timing.
A prioritized database is not the end of the process.
The webinar proposes taking the intelligence into an initial 90-day cycle divided into preparation, validation, activation, and learning. The goal is not to assume universal conversion rates, but to build your own baseline on which combinations of market, chain, account, signal, and offer actually generate conversations.
That approach also changes how a negative result is interpreted. When a hypothesis does not work, the answer should not automatically be to increase contact volume. First, it is worth reviewing: Was the evidence sufficient? Did we talk to the right role? Was there really a commercial moment? Was the entry offer right? Only then does it make sense to scale.
Turning that discipline into a process the sales team can run every quarter is, in practice, a process problem: who records the signal, who validates it, and what triggers the next step. That is where sales process automation comes in, including CRM integration.
The main lesson from the analysis of Mexico's Western–North Pacific region is that a large industrial market needs to be narrowed down before it becomes a sales strategy.
First, you identify where the activity is. Then, where observable B2B spending exists. Next, which categories are compatible with what a company sells. After that, which production chains, corridors, and accounts make sense. Finally, you look for signals that justify a sales action.
The methodology presented by Teseo Data Lab can be summarized as follows:
Category → Chain → Corridor → Account → Signal → Action.
It is not about finding more companies. It is about gathering enough evidence to know where it is worth investing the next sales effort.
The fastest-growing market is not necessarily the one that best fits your solution.
Teseo Data Lab analyzes what you sell, who you can serve, what your constraints are, and where there is enough evidence to focus your sales strategy. That is the work we do in our industrial market study and our industry research.
Write to us and we will tell you which regions, sectors, corridors, and account types are compatible with your company — including the case where the answer is that your priority market is not in this region.
💬 Request Sales Prioritization Consulting
Our team can generate a custom analysis with market intelligence specific to your area.
Request analysis
Teseo Data Lab is an active member of the OpenAI Partner Network at the Select tier. What it means for our clients, how the firm is evolving toward AI, Data & Industry Intelligence, and what was announced at OpenAI DevDay 2026.

Teseo Data Lab attended How AI Models Learn to Do Real Work, OpenRouter's event in San Francisco. How industrial data could serve as a reference to check whether an AI model does the work a company actually needs.

Teseo Data Lab took part in Supabase Select 2026 and its hackathon in San Francisco. Takeaways from Ant Wilson, Steve Wozniak and Garry Tan, Supabase's new features for agents, and H0 ConcreteOS, our proposal for evidence-backed industrial context.